
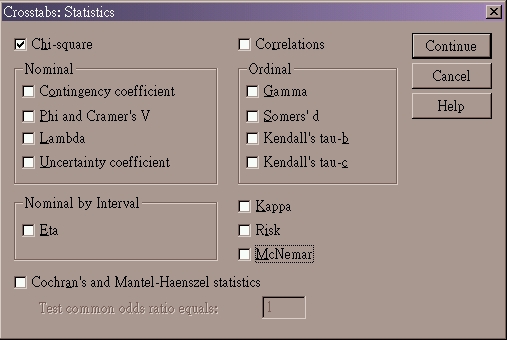
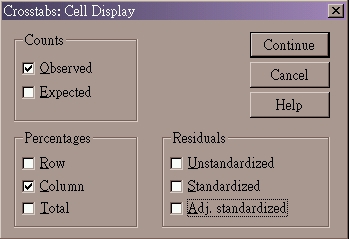
- the significance shows p=0.438
- in sociological research, typical level of significance adopted
to reject the null hypothesis is p
 0.05
0.05 - in the current example, 0.438 is much greater than 0.05, we are much confident in accepting the null hypothesis
- hence, we may conclude that sex and voting behavior have no relationship existing in our target population
- should such requirement is not fulfilled, a warning will be issued in the SPSS output
- in any circumstances if the proportion of cells with expected frequency less 5 is as high as 25% or more, the chi-square is not reliable
- you should consider again the classifications in the variables involved in the analysis,
- regroup some categories to yield more cases
- exclude categories with almost no or very few cases