RESEARCH
Research Fields and Current Research Interests
Rupture scenarios derived from interseismic locking models
The interseismic locking models derived from geodetic observations have been utilized in earthquake risk assessment as they reveal the slip deficit and stress accumulation on the fault. We derive rupture scenarios based on interseismic locking models in Nicoya. We find that the final rupture extent, magnitude, and ground motions are highly dependent on the hypocenter locations (Yang et al., 2019, EPSL).
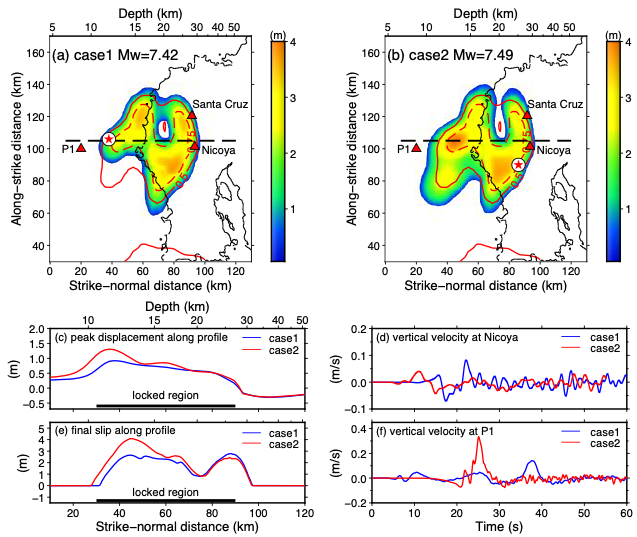
Figure 5 in Yang et al. (2019, EPSL). Final slip and ground motions in two ruptures derived from a locking model but with different hypocenter locations (red stars).
We derive rupture scenarios with the same hypocenter location with the 2012 Nicoya Mw 7.6 earthquake. The scenarios show great coherency with the 2012 Mw 7.6 event in rupture extent, magnitude, and moment rate function (Yang et al., 2019, JGR).
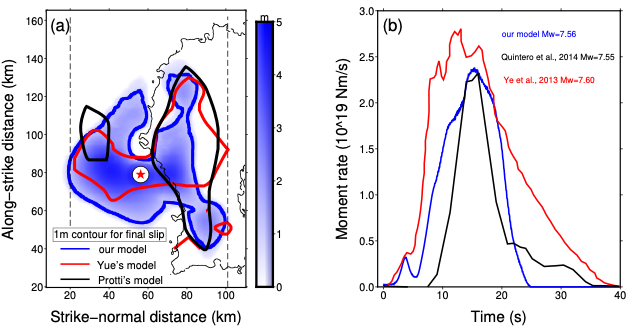
Figure 9 in Yang et al. (2019, JGR). Final slip and moment rate functions in a scenario derived from a locking model and kinematic models for the 2012 Nicoya Mw 7.6 earthquake.
We further examine the ground motion predictions in locking-based dynamic rupture scenarios by comparing them with the predictions from ground motion models (GMMs) and the observations in a real earthquake. The predictions are generally consistent with GMMs with some differences in attenuation rate and magnitude in the near field (< 30 km). However, the spatial patterns differ a lot from GMM-based predictions, mainly due to the rupture directivity effect. By comparing with scenarios under homogenous stress conditions, we observe the dependency of earthquake magnitude and rupture directivity on stress heterogeneity. The coseismic slip intends to negatively correlate with stress roughness. Furthermore, the predictions from one locking model capture most of the measurements on the local network during the 2012 Nicoya Mw 7.6 earthquake. Our results underline the necessity of involving rupture dynamics and stress heterogeneities in prescribing earthquake source process and highlight the potential application of locking models in seismic hazard assessment.
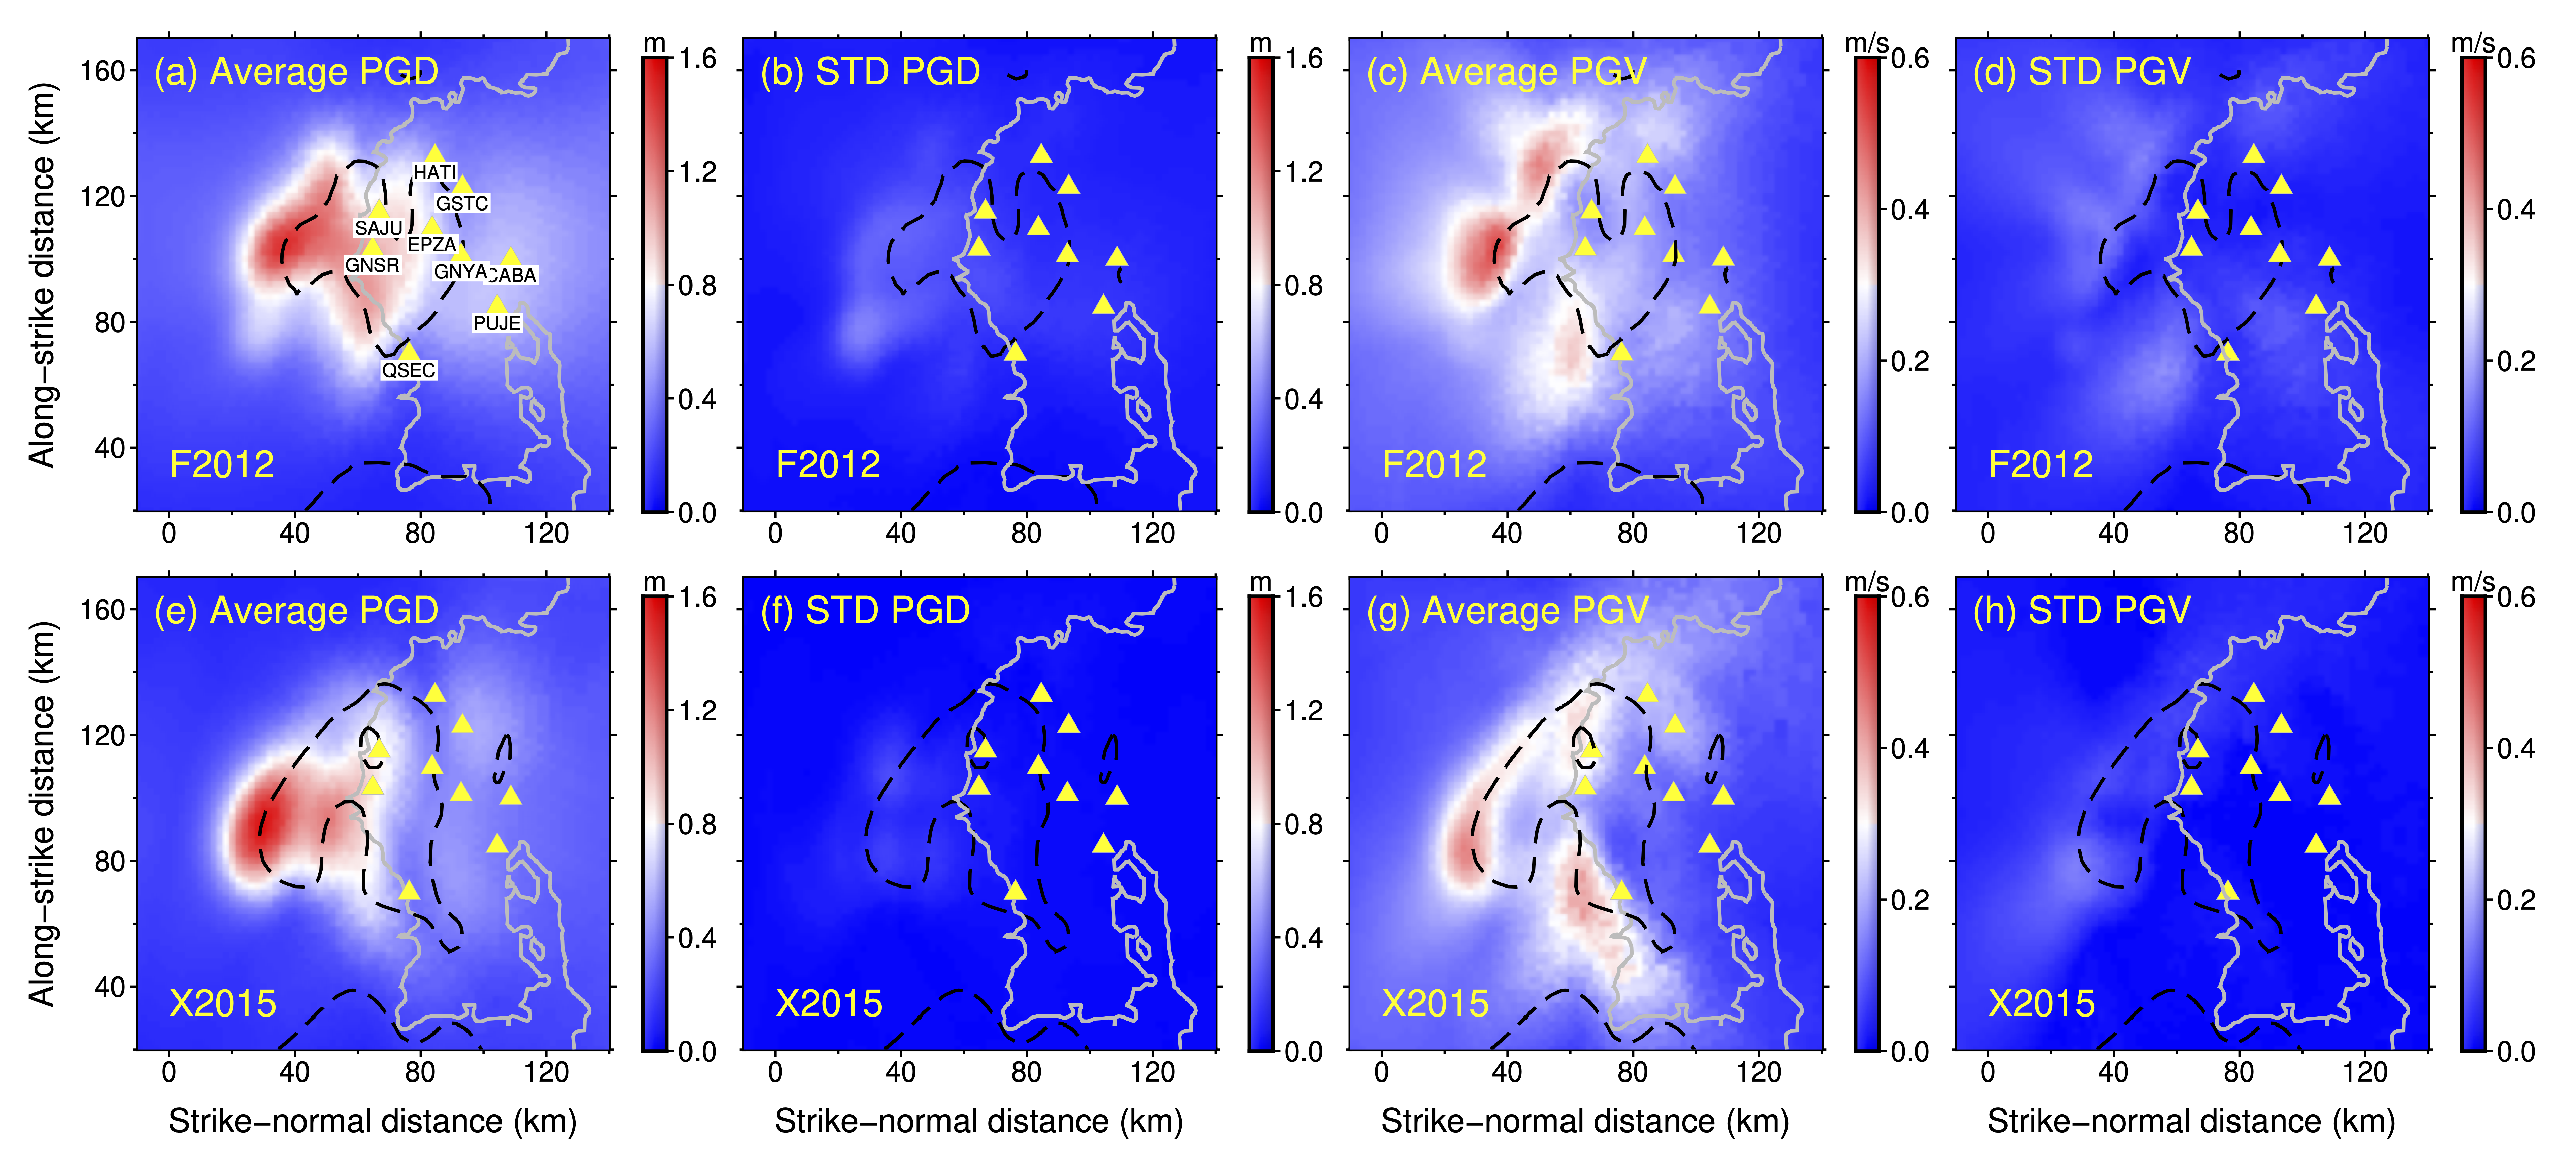
Figure 4 in (Yao and Yang, 2023 EPSL). Synthetic ground motion intensities in Mw ~7.5 dynamic scenarios from F2012 (a-d) and X2015 (e-h), including the average values and standard deviations for PGD (a, b, e &f) and PGV (c, d, g, &h). The dashed black contour represents the locking degree of 60%.
In addition, we estimate stress distribution from interseismic locking models and derive earthquake scenarios along the Anninghe fault in Sichuan, China, by conducting dynamic rupture simulations. The predicted rupture segmentation and moment magnitudes (Mw 6.9 – 7.3) are well consistent with historical earthquakes. Besides, we have observed models accompanied by continuous surface rupture, with surface offsets comparable to the values identified in field surveys of historical earthquakes. In addition, the surface rupture and the shallow slip deficit (SSD) vary drastically among models with different hypocenters, demonstrating that the earthquake process is indeterministic. The coseismic moment predicted in our models is ~50% of what was anticipated from the static locking model. Our results highlight that those rupture scenarios derived from the locking-based heterogeneous stress can further contribute to the seismic hazard assessment.
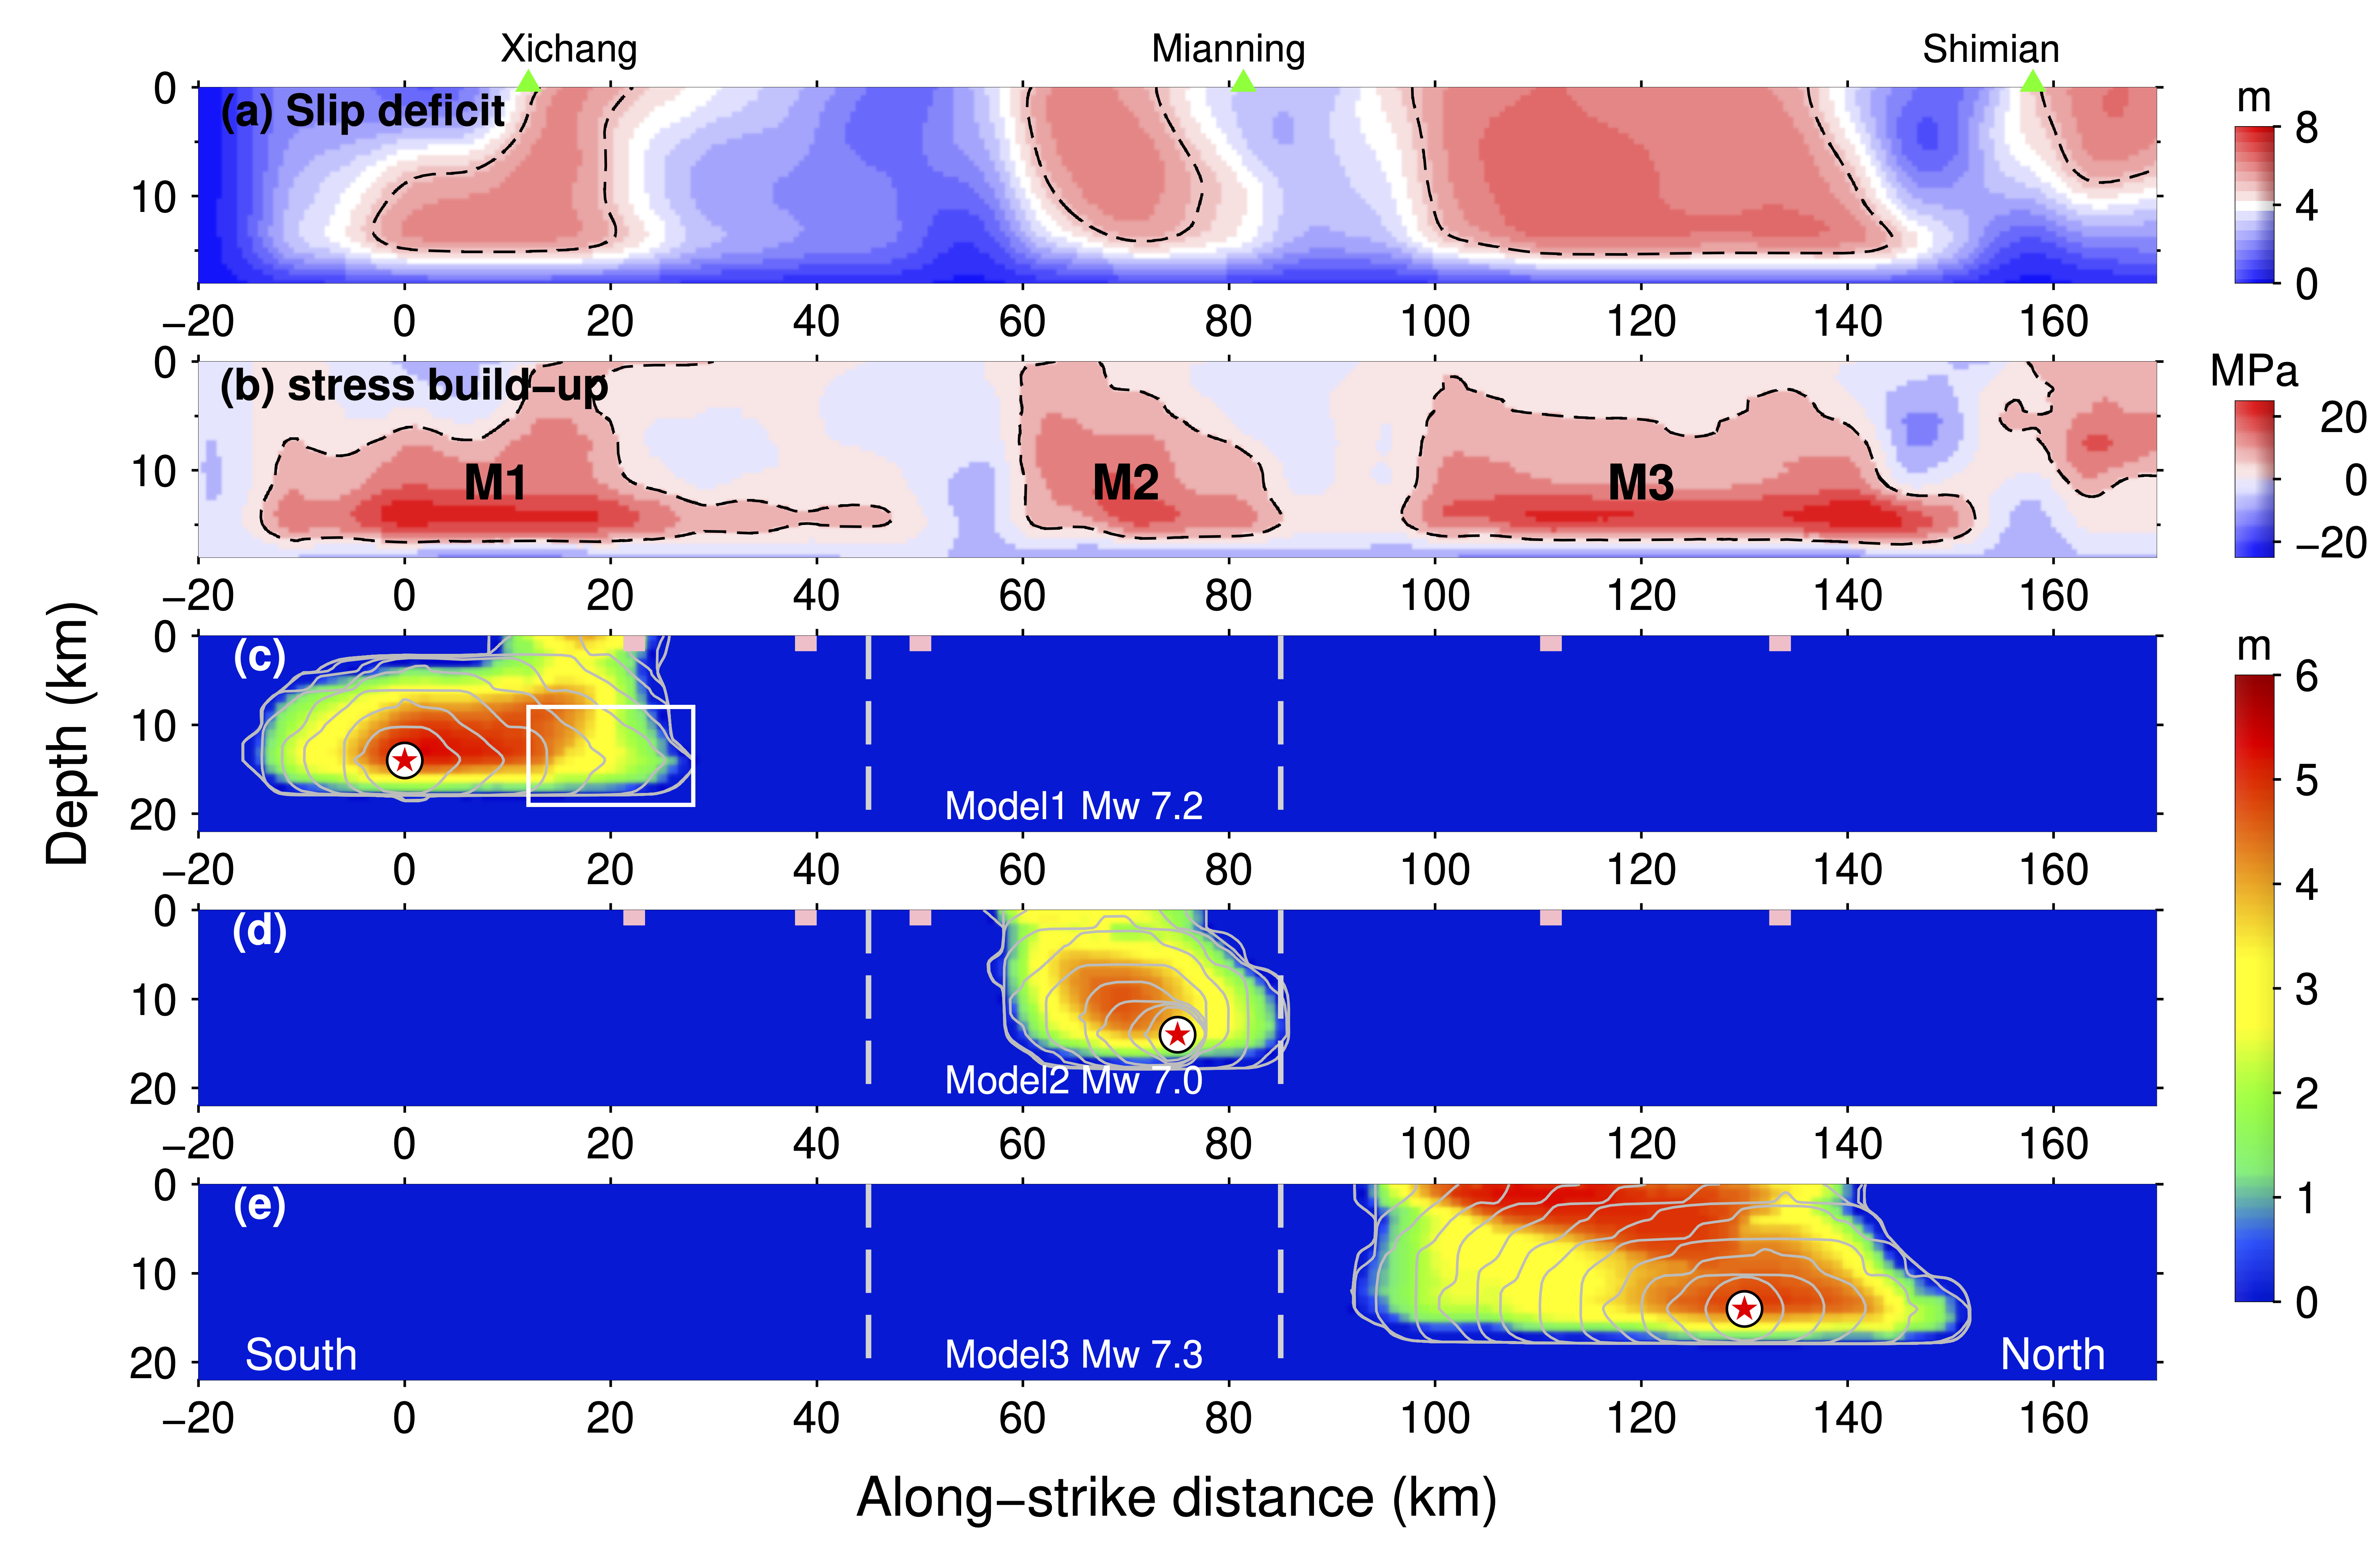
Figure 2 in (Yao and Yang, 2021 EPSL): (a) Total slip deficit on the Anninghe fault. (b) Stress build-up on the fault caused by the slip deficit (cde) Final slip distribution of dynamic rupture models on three segments.
Rupture dynamics and earthquake physics
Seismic hazard assessment demands understanding on earthquake rupture process. We conduct numerical simulations to investigate the factors that impact earthquake rupture development using general models. For instance, we find that the barrier on the fault may slow and stop ruptures but may also induce supershear ruptures (Weng et al., 2015); we find that damage fault zones can promote rupture extent and increase earthquake potency (Weng et al., 2016); seismogenic width controls aspect ratios of earthquake ruptures (Weng and Yang. 2017).
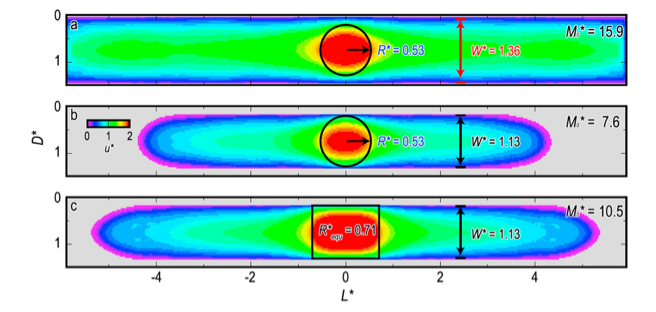
Figure 2 in Weng & Yang (2017). Final slip in models with different seismogenic width and nucleation size.
Dynamic source parameters are of great significance to reveal the mystery of earthquake physics, yet difficult to be constrained from direct observation. Using numerical simulations, we investigate the estimation results of slip weakening distance (Dc) from near-fault displacement (Dc''). We found seismogenic width may cause a linear scaling of Dc'' even with the constant real Dc; existence of low-velocity fault zones may lead to huge overestimation.
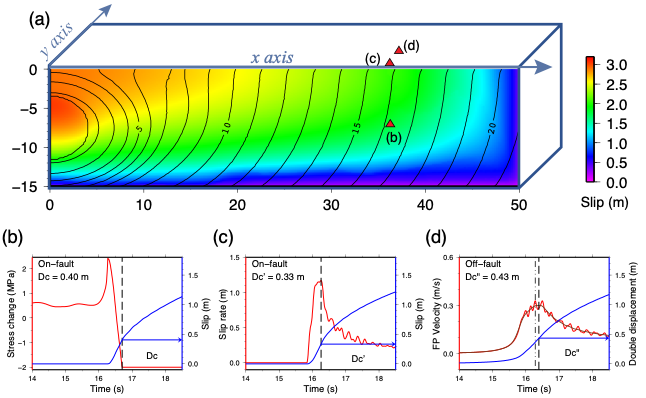
Figure 2 in Chen & Yang (2020). Illustration of determining Dc, Dc' and Dc'''
Despite general models, we conduct dynamic rupture simulations for large earthquakes including the 2012 Nicoya Mw 7.6 earthquake and 2015 Nepal Mw 7.8 earthquake. Near-field observations are utilized to constrain the rupture models and the frictional properties on faults. Our dynamic rupture models can excellently fit the near-field observations and reveal the dynamic source parameters on seismogenic faults.
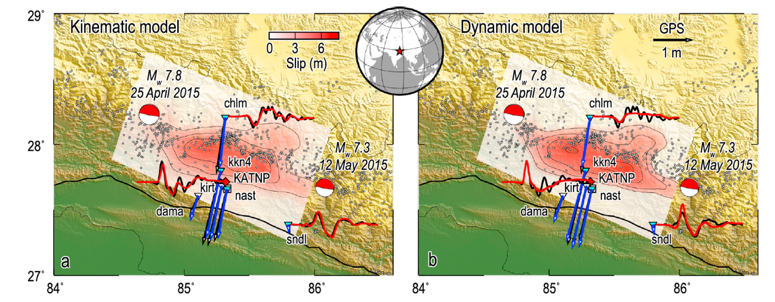
Figure 1 in Weng & Yang (2018). Kinematic and dynamic models for the 2015 Nepal Mw 7.8 earthquake.
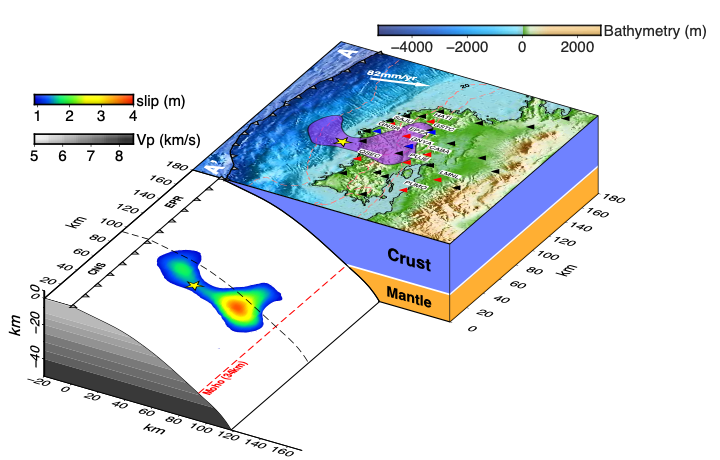
Figure 1 in Yao & Yang (2020). 3-D map for the 2012 Nicoya Mw 7.6 earthquake
Subduction zone dynamics and megathrust earthquakes
The Mariana subduction zone is part of the Izu-Bonin-Mariana (IBM) subduction system. Subduction zone megathrusts host Earth’s largest earthquakes, however, the Mariana subduction zone is characterized as an “aseismic” end-member due to the absence of megathrust earthquakes with magnitudes greater than 8. The “aseismic” Mariana has been related to its special tectonic setting, such as steep subducting slab, fore-arc extension, back-arc spreading and widespread serpentinization. Due to their great water depth, it is challenging to investigate subduction zones. Using ocean bottom seismographs (OBS) can significantly improve our studies on the structure and dynamics at subduction zones. We use multiple seismic techniques to investigate the seismicity and seismic structures through multiple OBS experiments near the Challenger Deep in the southern Mariana subduction zone.
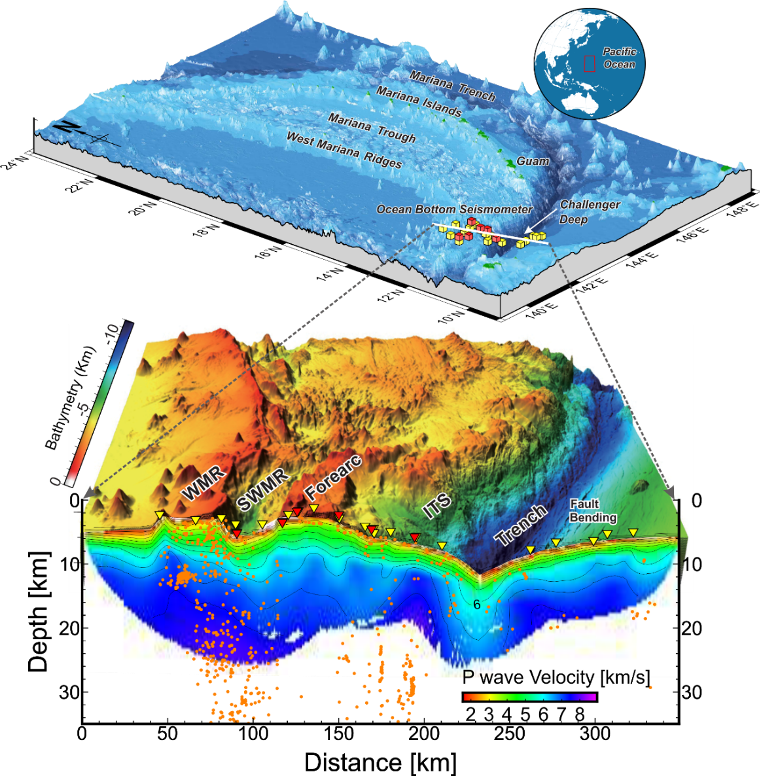
Top: The 3D view of Mariana subduction zone and deployed Ocean Bottom Seismomter. Bottom: the 2D view of seismicity projected on the P wave velocity model.
We delineated the subducting interface and plate deformation from seismicity distribution. The earthquakes span over the Southwest Mariana rift, the megathrust interface, forearc and outer-rise regions. While most earthquakes are shallow, depths of the slab earthquakes increase from ∼100 to ∼240 km from west to east towards Guam. We also delineate the subducting interface from seismicity distribution and find an increasing trend in dip angles from west to east. The observed along-strike variation in slab dip angles and its downdip extents provide new constraints on geodynamic processes of the southernmost Mariana subduction zone.
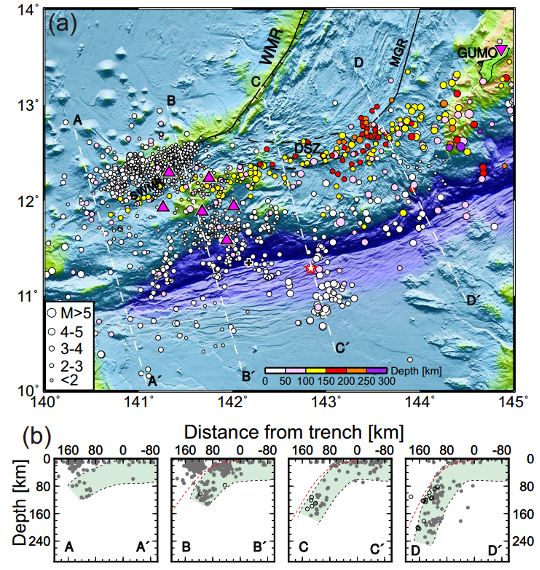
Fig. 9 in (Zhu et al., Geophys. J. Int, 2019). Map view (a) and cross-section view (b) of all located earthquakes.
The lithosphere bends at subduction zone and induces outer-rise normal faulting earthquakes which may trigger large tsunami and cause significant loss of life and damage. We developed the 3-D plate bending model and the particle swarm optimization (PSO) inversion model programs to study the 3-D bending deformation of subducted plate. We focus on the relationship between plate bending deformation, in-plate stress and the distribution of outer-rise earthquakes at the southern Mariana Subduction. Our investigations show that the change of plate deformation along the trench strike can produce variation of bending shear stress, which may cause the uneven distribution of outer-rise earthquakes.
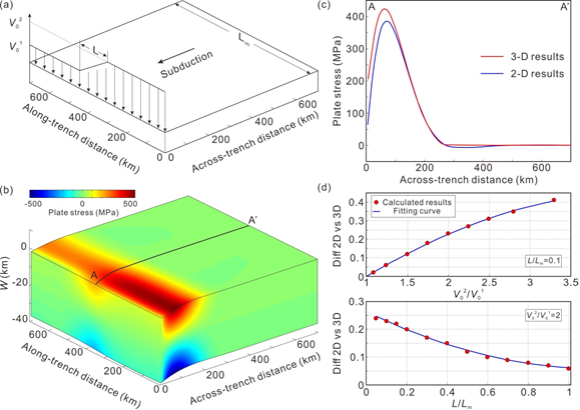
Fig S6 in (Zhang et al., Tectonophysics, 2021). The difference between the 2-D and the 3-D model on estimating the bending stress. (a) Schematic model (b) The 3-D bending stress distribution (c) The difference of the bending stress between the 2-D and the 3-D model (d) Plotting difference between the 2-D and the 3-D model versus the change of V0 (V02/V01) and the L/Lm.
Subduction zones play important roles in material cycling and earthquake generation on the Earth. Estimating the amount of water carried by the subduction zone into Earth's interior plays an important role in the global water cycle, but is poorly constrained at subduction zones due to the lack of near-field observations. We utilize data recorded by OBS near the Southern Mariana Trench. Using seismic imaging methods, we construct an SV-wave velocity model beneath the southernmost Mariana subduction zone. Our model demonstrates low-velocity anomalies within the upper ∼25 km mantle near the trench, suggesting a large amount of water input in southern Mariana. Furthermore, our seismic observations suggest that low degree serpentinization of the forearc mantle in southern Mariana than central Mariana, agree with the lacking of serpentinite mud volcanoes in the forearc.
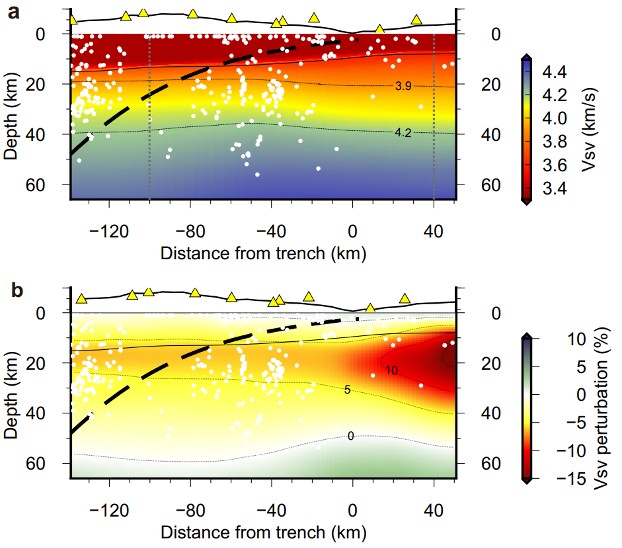
Fig 3 in (Zhu et al., Geophys. Res. Lett., 2021). Velocity profile (a) and velocity perturbation relative to the initial model (b) in southern Mariana.
High-resolution imaging of crustal fault zones and subsurface structure
Beside source physics, crustal structure is another critical issue in seismology. Crustal fault zones (FZ) host earthquakes, which may produce permanent damage and generate a low‐velocity zone (LVZ). The LVZ properties have profound impacts on earthquake nucleation and rupture propagation. Moreover, the shallow structure may significantly impact near-fault ground shaking intensities during earthquakes. To derive high‐resolution FZ structure of the Chenghai fault in Yunnan, southwestern China, we deployed a linear dense array crossing the fault from January to February 2018. The array consisted of 125 short‐period (5 s) three‐component instruments and spanned an aperture of ~8 km with average station spacing of 40–50 m. We derived high‐resolution subsurface structures beneath the array.
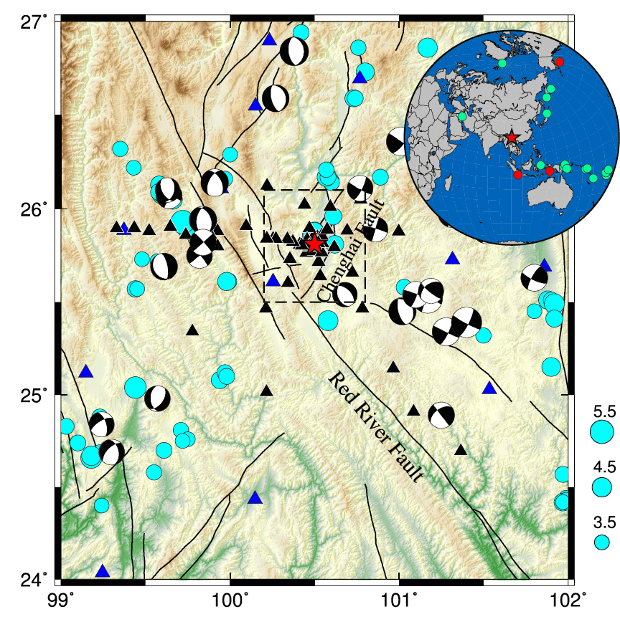
Figure 1 in Yang et al. (2020). Map showing the location for the study region (black dashed box) and faults there (black lines).
Our ambient noise tomographic results showed a distinct LVZ with a width of 3.4 km across the CHF. The LVZ extended to 1.5 km in depth and likely represents nonuniform distribution of sediments during the formation and evolution of Binchuan basin, to which the CHF was one of the controlling factors. Considering the large population in the Binchuan basin, the newly discovered wide LVZ associated with the CHF could be an important factor for seismic hazard assessment, as it may amplify ground motion in future earthquakes.
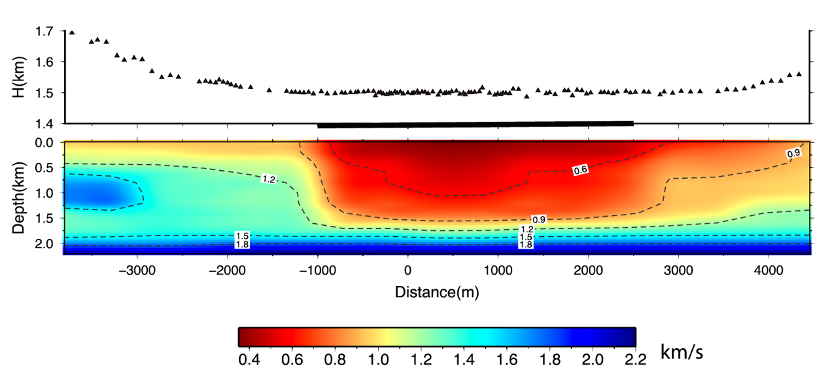
Figure 7 in Yang et al. (2020). Top: station locations and altitudes. Bottom: shear wave velocity models derived from ambient noise tomography.
We have also developed a dense-array-based receiver function travel-time inversion method that can image the Depth Extent and Vp/Vs Ratio of LVZ. By applying this method to seismic data of the aforementioned array across the CHF, we further constrain the depth of LVZ to be about 1.1 km. The theoretical travel time delay patterns based on the newly derived Vp and Vs models are more consistent with the observations.
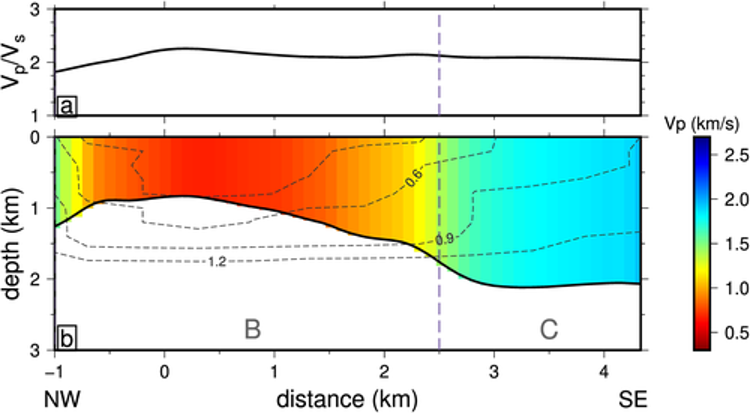
Constrain LVZ depth using receiver function
Induced earthquakes
Anthropogenic activities such as underground liquid injection are known to likely cause earthquakes. In recent decades, there raise social concerns on the damage caused by those induced events. The Hutubi underground gas storage facility in Xinjiang, China, with a maximum gas storage capacity of 10.7 billion m3, provides a good opportunity to study seismicity potentially induced by the annually cyclic injection and extraction of natural gas.
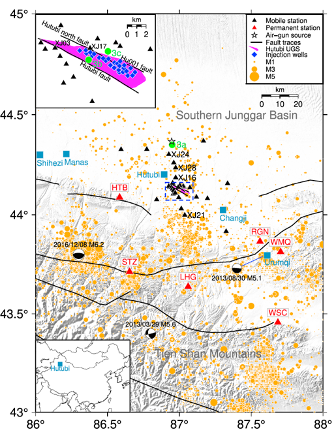
Figure 1 in Zhou et al (2019). The Geographic map of the study region. The lower left inset marks the location of the Hutubi County in China.
To statistically distinguish induced seismicity from the tectonic background, we investigate the background seismicity probability of each event using the space‐time epidemic‐type aftershock sequence model (ETAS) and a stochastic declustering method. Moreover, we relocate earthquakes by incorporating a dedicated mobile seismic network after refining the regional 1D velocity model by utilizing an artificial source. Both our ETAS modeled results and our high‐resolution relocations suggest gas‐injection‐induced seismicity adjacent to the Hutubi UGS during the first and second injection periods. Focal mechanism solutions of the two largest earthquakes (Mw 2.8 and 3.0) in August 2013 show a possibly unmapped reverse fault gently dipping to the south. Based on our high‐resolution earthquake locations, we propose that these on‐fault earthquakes are not hydrologically connected with the reservoir formation but are likely induced by poroelastic stress perturbations due to gas injection.
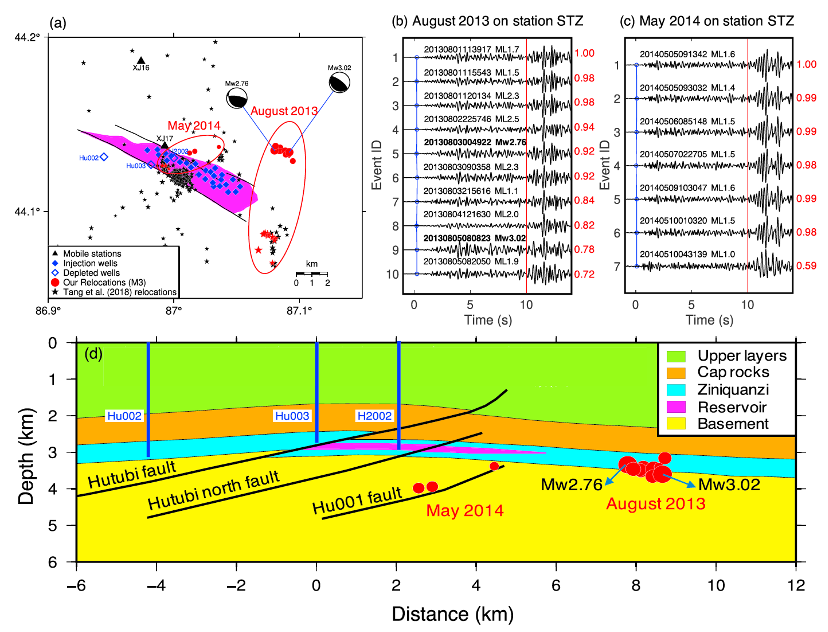
Figure 8 in Zhou et al (2019). Relocated earthquakes near the Hutubi UGS. (a) Locations of studied cases. (c&b) waveforms on station STZ of relocated events. (d) Relocated earthquakes projected onto the geological formations.
Earthquake detection and source parameter investigation
Fault-Plane Determination of the 4 January 2020 Offshore Pearl River Delta Earthquake and Its Implication for Seismic Hazard Assessment
The Guangdong–Hong Kong–Macau Bay Area (GHMBA) surrounding the Pearl River Estuary (PRE) is one of China’s most critical financial circles, and coastal earthquake hazard has become an increasing concern. To investigate the seismogenic fault and its rupture directivity of 4 January 2020 ML 3.5 earthquake (the only M> 3 earthquake within the PRE since 1900), we determined the focal mechanism of the mainshock using the cut-and-paste method and conducted forward modeling to retrieve the rupture directivity of the mainshock, using waveforms of one aftershock as empirical Green’s functions. The results demonstrate that this earthquake was an Mw 3.7 strike-slip event, with a focal depth of 10 km. The rupture direction of the mainshock was 78°, consistent with the northeast-east-trending fault system in the region. The identified source fault confirmed a seismogenic segment of the northeast-east-trending fault system in the PRE, which is the primary source of seismic hazard in the area.
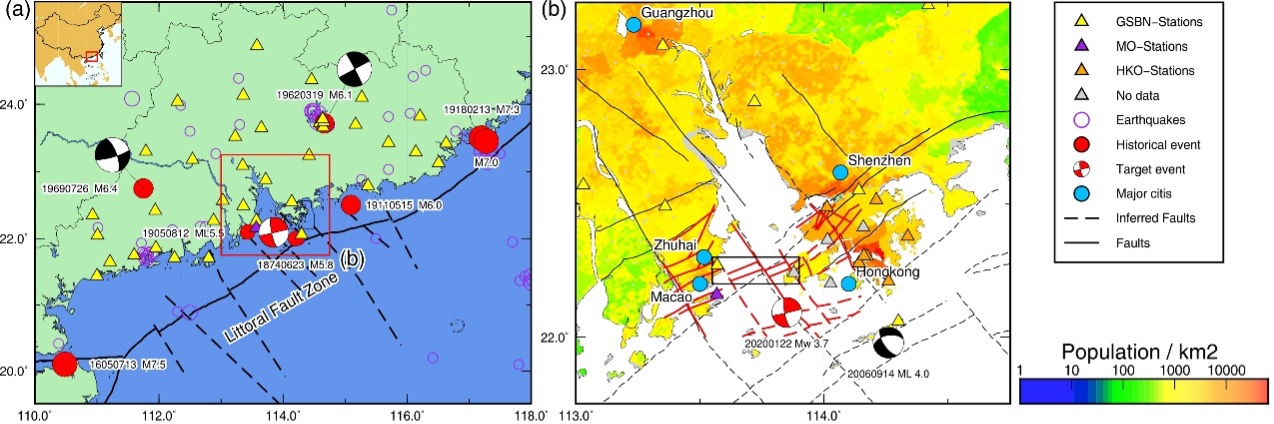
Figure 1 in Chen et al (2021). (a) Locations of seismograph stations and historical earthquakes, and faults. The focal mechanism plots (not in scale) represent the focal mechanisms of the mainshock (red) and historical earthquakes (black). (b) Zoom in view of the Pearl River Estuary, Showing the locations of major cities and Hong Kong Observatory Network (HKO) stations, and faults. The focal mechanism plots have the same meaning as panel (a).
An Ms 6.4 earthquake struck Yangbi County in western Yunnan province, China, on 21 May 2021, causing damage in the nearby region. Intensive foreshock activity started three days before the mainshock, and numerous aftershocks followed along a northwest–southeast-trending right-lateral main rupture fault. Double-difference relocation of the foreshock and aftershock sequence shortly before and after the Ms 6.4 mainshock is conducted using the phase picks from the local seismic network. The focal mechanisms of relatively large foreshocks and aftershocks are also derived. The results not only delineate the ruptured fault geometry during the mainshock but also indicate the mechanism of static stress transfer according to the spatiotemporal evolution of foreshocks.
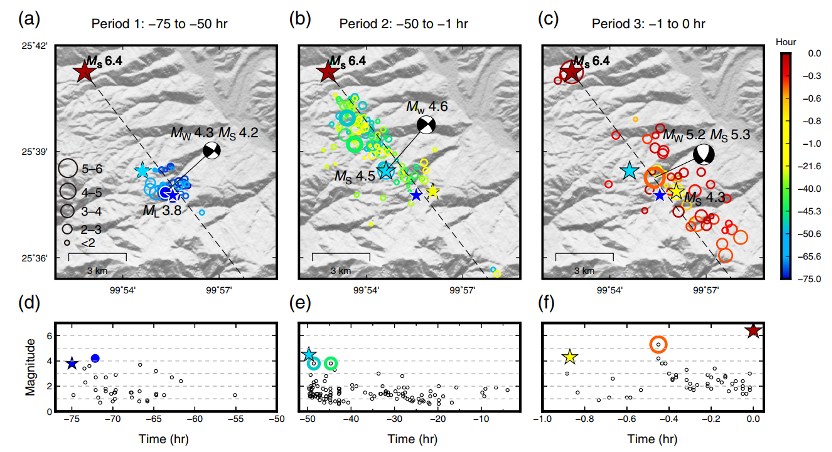
Figure 7 in (Zhang et al., SRL, 2021). Spatial–temporal evolution of the foreshock sequence colored by their original time relative to the Ms 6.4 mainshock in three time periods: (a) −75 to −50 hr, (b) −50 to −1 hr, and (c) −1 to 0 hr.